Monday 5 October 2015

DIY real-time security camera with a Raspberry Pi & Telegram for $85 / Rs. 3000

In a few months, I'm moving to my new house. (Yes, I'm getting married!)
Currently it's uninhabited and empty with no one (except neighbours) to check on it.

I thus decided to build a security camera using a Raspberry Pi that I had lying around and buying some additional components.

The result was pretty cool. With an additional Rs. 1200 (around $35) and building mostly on open technologies, I was able to build a security system with motion detection and which also works in the dark. As soon as movement is detected in front of camera, a photo + small video is sent to my Android smartphone on the Telegram app (An app similar to WhatsApp). Although it's quite simple and many things can be improved, it does the job and is pretty cool.


Things you will need

1. Raspberry Pi + SD card (~$45, without casing)
I would recommend you to buy from ModMyPi where the shipping to Mauritius is relatively low. This bundle comes with an 8GB micro SD card. In my case I've used the old version: Raspberry Pi 1 Model B which is around 4 times less powerful than a Raspberry Pi 2 but which still does the job well.

http://www.modmypi.com/raspberry-pi/rpi2-model-b/raspberry-pi-2-model-b-new-and-8gb-microsd-card-bundle/


You might also want a small casing to keep everything neat.

http://www.modmypi.com/raspberry-pi/cases/modmypi-single-colour/modmypi-modular-rpi-b-plus-case-clear

2. Pi NoIR camera (~$23)
This is the camera module that plugs into the Raspberry Pi board.
It's important to take the NoIR model since there is No InfraRed filter on the camera. The normal camera model contains an infrared filter and won't allow you to see in the dark. The camera normally works with both Raspberry Pi 1 and 2 models.
http://www.modmypi.com/raspberry-pi/camera/raspberry-pi-noir-infrared-camera-board-5mp-1080p-v1.3/

3. Infrared illuminator ($8 - illuminator + $6 - 12V adapter)
This is the thing that will allow the Pi camera to see in the dark.
Think of it as a lamp which is emitting light in the infrared spectrum instead of the visible spectrum.
You won't see anything with your naked eyes but the camera will.

I bought this one from eBay which also auto powers-on in the dark. You'll also need a 12V 1A AC to DC adapter with a 2.1mm jack (it's a standard size). I bought mine for Transcom, Rose Hill for around $6.
http://www.ebay.com/itm/48-Infared-LED-Dome-illuminator-light-for-CCTV-Surveillance-IR-Night-Vision-/251673409738?hash=item3a98e778ca

4. Ethernet cable or a WiFi / 3G dongle
To connect the Raspberry Pi to the internet, you have 3 options:
1) Via Ethernet - most reliable and easiest way

2) Via WiFi - less reliable and a bit more difficult to set up
http://www.modmypi.com/raspberry-pi/accessories/wifi-dongles/wifi-dongle-nano-usb
https://www.modmypi.com/blog/how-to-set-up-the-ralink-rt5370-wifi-dongle-on-raspian

3) Via a 3G dongle - very difficult / not recommended unless you have constraints like no internet connection on site. Be careful with the dongle you choose - not all of them are compatible with the RPi.

Connecting the camera to the Pi

Connecting the camera to the Pi is very easy. Just push on the sides of the slot, then pull upwards and afterwards insert the camera ribbon. You can follow this guide:


Installing Raspbian on the SD Card

You now need to install Raspbian (a Debian-like linux distribution for the RPi) on the SD/MicroSD card.

1. Download Raspbian from here: https://downloads.raspberrypi.org/raspbian_latest
2. Extract the ZIP file
3. Follow one of the guides below, depending on your OS, to write the .img file to the SD card:

Booting into Raspbian

It's now time to configure Raspbian.
Connect your Raspberry Pi to a USB power source and to your screen via the HDMI port.
You'll also need to connect a keyboard via one of the USB ports.

It will boot up and you'll see a screen like this one:


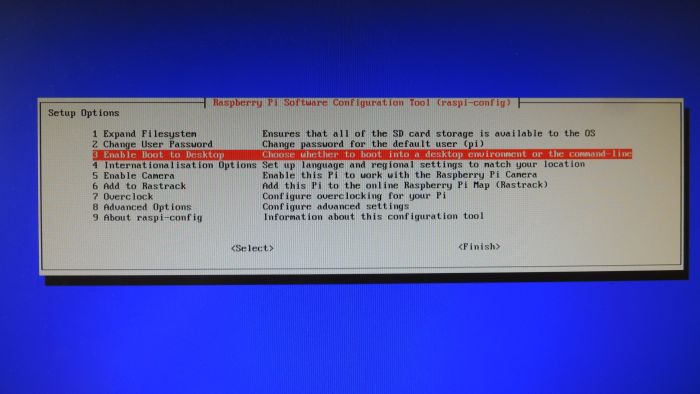
Select 1. Expand Filesystem, and when it's back to the menu, move down and enable the camera by selecting 5. Enable Camera

Now choose Finish and choose Yes when prompted to reboot.

That's it. If you ever need to change any configuration option, you can type sudo raspi-config at the terminal. Also, the default credentials to login on raspbian are:
Username: pi / Password: raspberry

Disabling the Pi NoIR camera LED

By default, the Pi NoIR has a bright red led when you're using it.
If you want to disable the camera led, add the following at the bottom of /boot/config.txt and reboot:

 disable_camera_led=1  

Creating a Telegram bot

We're almost there! Now to an interesting part.
Have you heard of Telegram Messenger? If not, check out this link!

It's a really beautiful & fast app with tons of functionalities. I personally find it better than WhatsApp but it still has not caught up yet with WhatsApp's huge user base.

Anyway, Telegram provides you with a handful of APIs, one of which is the Bot API which we'll use here. It allows you to automatically send messages/photos/videos/... to your phones without any restriction! Think of all the things that could be done with the IoT (internet of things) wave that's coming!

Create a bot using the Botfather


In Telegram, a bot appears just like a normal contact. To create a bot for yourself, you need to use the Botfather who is also... a bot  :)

1) To get started, install Telegram Messenger on your smartphone - it's available for Android, iOS, PC and Mac.

2) Now, open your smartphone's web browser and navigate to https://telegram.me/botfather

3) Click on "Send Message" and choose "Telegram" to open the link. This will open up a conversation with the Botfather in Telegram.

4) Detailed bot creation instructions can be found here: https://core.telegram.org/bots#botfather
You can set a name, profile pic and description, etc. via various commands.

Below are basic guidelines to create the bot. Just type the /newbot command to get started. (Of course use your own bot names)

 You: /newbot   
 Botfather: Alright, a new bot. How are we going to call it? Please choose a name for your bot.  
 You: My Bot Name  
 Botfather: Good. Now let's choose a username for your bot. It must end in `bot`. Like this, for example: TetrisBot or tetris_bot.  
 You: MyBotUsername_bot  
 Botfather:  
 Done! Congratulations on your new bot.  
 You will find it at telegram.me/MyBotUsername_bot. You can now add a description, about section and profile picture for your bot, see /help for a list of commands.  
 Use this token to access the HTTP API:  
 110201543:AAHdqTcvCH1vGWJxfSeofSAs0K5PALDsaw  
 For a description of the Bot API, see this page: https://core.telegram.org/bots/api  

You can add a profile pic for the bot using /setuserpic and a description using /setdescription
Now, still in the Bot Father chat window, let's add some commands that we'll use in our scripts:
 You: /setcommands  
 BotFather: Choose a bot to change the list of commands.  
 You: [select your bot from the list]  
 Botfather: OK. Send me a list of commands for your bot. Please use this format:  
 command1 - Description  
 command2 - Another description  
 You: activate - Enable sending of photos and videos  
 deactivate - Disable sending of photos and videos  
 status - Check if the camera is online  
 Botfather: Success! Command list updated. /help  

To add the bot to your chat list, go to telegram.me/MyBotUsername_bot from your smartphone's browser. That's it! Keep a copy of the token highlighted in green and don't share it to anybody! This is your key to control the bot.

Installing python-telegram-bot

To send messages to our phone from the Pi, we need to communicate via the Telegram Bot API. Everything is documented here. You can communicate directly by sending GET/POST requests but to make things easier we'll use python-telegram-bot which is a python wrapper library around the Bot API. Let's install it!

Update package lists:
 sudo apt-get update

Install pip (a python package manager)
 sudo apt-get install python-pip  

Use pip to install python-telegram-bot
 sudo pip install python-telegram-bot  

Installing Motion on the Raspberry Pi (dependencies only)

Motion is a software motion detector for linux. It's a very powerful tool with many advanced features. Unfortunately, the Pi camera was not supported until some guy modified motion and added support for it.

I used this guide to install motion. Below are the steps - login to your Pi and run the following commands (you must be connected to internet):

Update package lists:
 sudo apt-get update

Install motion + its dependencies
 sudo apt-get install motion  

Remove motion, but keeping dependencies installed.
 sudo apt-get remove motion  

Install libjpeg62
 sudo apt-get install libjpeg62  

At this point, motion is not yet installed, but it will be installed in the next section when we are deploying all our scripts to the Pi.

Deploying our custom scripts to the Raspberry Pi

Finally, we've reached the most important part where we'll deploy motion-mmal + the custom scripts we've developed. All files are hosted on github.

 sudo bash
 cd /home/pi/  
 git clone https://github.com/shaan1337/pitelegramcam.git  
 chmod +x pitelegramcam/security/*.sh  
 chmod +x pitelegramcam/security/scripts/*.py  
 chmod +x pitelegramcam/security/motion  

Now edit the file located at ./pitelegramcam/security/scripts/myconfig.py using your favorite text editor (e.g. nano):
 #!/bin/python  
 import os  
 #Set your bot token here  
 token = '123456789:ABCDe-11111111111111111111111111111'  
 #Set the user or group chat id here  
 chat_id = 123456789  
 #cd to the script's directory  
 abspath = os.path.abspath(__file__)  
 dname = os.path.dirname(abspath)  
 os.chdir(dname)  

Replace the green part with the bot token noted previously in Create a bot using the BotFather section (the single quotes are necessary).

Replace the blue part by your Telegram chat id (a unique number representing your account). To get it, send a message to your bot via Telegram e.g. "test 1234". Now from your Pi, run:

 curl https://api.telegram.org/bot123456789:ABCDe-11111111111111111111111111111/getUpdates  

You should see something like that:
 {"ok":true,"result":[{"update_id":144808049,  
 "message":{"message_id":697,"from":{"id":115803478,"first_name":"John","last_name":"Smith","username":"Ox1337"},"chat":{"id":115803478,"first_name":"John","last_name":"Smith","username":"Ox1337"},"date":1444064795,"text":"test 1234"}}]}  

Your chat id is the text in blue.
Now let's move to next section and get start everything up!

Starting it up!

That's it! We're finally done.

To launch our security camera run the following:
 sudo /home/pi/pitelegramcam/security/start.sh  

You can add the above line (without sudo) at the bottom of the file /etc/rc.local to start everything automatically at startup.

Now, try to move in front of the camera and do funny things! You should receive a photo and small video within a few seconds!

From your bot you can also send the commands /activate, /deactivate and /status.

To stop the motion detection:
 sudo /home/pi/pitelegramcam/security/stop.sh  

You can also tune the parameters in motion-mmalcam.conf for better results. The following lines might be of interest:

 # Maximum number of frames to be captured per second.  
 # Valid range: 2-100. Default: 100 (almost no limit).  
 framerate 4  

 ############################################################  
 # Image File Output  
 ############################################################  
 # Output 'normal' pictures when motion is detected (default: on)  
 # Valid values: on, off, first, best, center  
 # When set to 'first', only the first picture of an event is saved.  
 # Picture with most motion of an event is saved when set to 'best'.  
 # Picture with motion nearest center of picture is saved when set to 'center'.  
 # Can be used as preview shot for the corresponding movie.  
 output_pictures best  

 ############################################################  
 # OpenMax/MMAL camera support for Raspberry Pi  
 ############################################################  
 mmalcam_name vc.ril.camera  
 mmalcam_control_params -fps 10  
 # Ignore sudden massive light intensity changes given as a percentage of the picture  
 # area that changed intensity. Valid range: 0 - 100 , default: 0 = disabled  
 lightswitch 10  

 # Specifies the number of pre-captured (buffered) pictures from before motion  
 # was detected that will be output at motion detection.  
 # Recommended range: 0 to 5 (default: 0)  
 # Do not use large values! Large values will cause Motion to skip video frames and  
 # cause unsmooth movies. To smooth movies use larger values of post_capture instead.  
 pre_capture 2  

 # Event Gap is the seconds of no motion detection that triggers the end of an event.  
 # An event is defined as a series of motion images taken within a short timeframe.  
 # Recommended value is 60 seconds (Default). The value -1 is allowed and disables  
 # events causing all Motion to be written to one single movie file and no pre_capture.  
 # If set to 0, motion is running in gapless mode. Movies don't have gaps anymore. An  
 # event ends right after no more motion is detected and post_capture is over.  
 event_gap 3  


Going further

Our security camera is pretty sophisticated at this stage but there's so much more you can do! Below are some ideas:
* Hook up a speaker which allows you to play a loud sound when sending a command. You could also use Telegram sound recording and play your own voice through the speaker to scare thieves off!
* Adding multiple cameras. A Pi supports only 1 Pi camera but you can try adding additional IP cameras and configure them in motion.
* Power backup using USB chargers.

Feel free to also post your ideas!

Hope you've enjoyed reading! Happy hacking!

Friday 25 September 2015

Very Naive Prediction Of Sea Levels Around Maldives

Growing up I had once heard, somewhere by someone, that one day the Maldives will be completely submerged by the sea. I decided today that I should try to see the likelihood of this happening using data available. However, this is only a naive prediction taking very few factors into consideration and should not be interpreted seriously. I hope that you have as much fun reading it as I had writing it!


Getting Sea Level Data

Note: If you feel lost it is recommended that you read the previous post about data before continuing.

We start by looking for a source of data. For this post we are using that of the Physical Oceanography Distributed Archive Center. More specifically the data and the user handbook can be found in the links below.

Data: ftp://podaac-ftp.jpl.nasa.gov/allData/ostm/preview/L2/GPS-OGDR/
User Handbook: ftp://podaac-ftp.jpl.nasa.gov/allData/ostm/preview/L2/GPS-OGDR/docs/userhandbook.pdf

Understanding Sea Level Data

Using Panoply to visualize the data we see the following.

Notice that we have latitude, longitude and sea surface height. Latitude and Longitude can be used to monitor the sea levels around Maldives specifically. But the description of sea surface height had left me perplexed about what the reference ellipsoid was. Thankfully, reading through the documentation we can then find out the following:

Now that everything is clear and simple, we can start by processing some sample data(not all, blaming my internet connection) from 2009 to 2015.

Using Sea Level Data

First thing we do is to identify a useful filter variable for our data, the surface type which we would conveniently set to Ocean.
Then, we find the latitude and longitude bounds of Maldives, approximately 74.4E 7.5S to 72.0E 1.3S.

Going through the documentation and after analysing the sea surface height of this area we come to realise that the values are negative. This is likely due to the fact the reference ellipsoid is an approximation and that it is above ocean surface(in this area), making the range bigger than the altitude, hence giving the sea surface height a negative value. However, we should still be able to use the negative values to get an idea of the change in sea surface height. Taking only September values of years 2015 to 2009 we get the following data(again limited by my internet connection):
 
year ssh(m) change(m)
2015 -22.21 0.029
2014 -22.239 -0.021
2013 -22.218 -0.003
2012 -22.215 0.006
2011 -22.221 0.023
2010 -22.244 -0.004
2009 -22.24

and
SSH(y-axis)

Change in SSH(y-axis)
these weird line graphs, but it is somewhat consistent with the overall rate of change of sea level which is 3.22mm per year. 2009 to 2015 with a rate change of 3.22mm would give a rise of 19.32mm, here we have an average change of 5mm. I must definitely be doing something wrong but also may be that is only true for the area around Maldives.

Moving forward anyway, Maldives hasan average ground level elevation of 1.5 metres (4 ft 11 in) above sea level, taken from Wikipedia this time. But more interestingly as depicted by the following article is that Maldives will lose 77% of it's land with 50 cm of sea level rise.

Here 50cm sea rise will be 500/5 will be 100 years, which is not that much, and a number scarily matching that of the article's!


Final words

After trying to predict sea level and failing at it, I ended with a new found respect for people who study oceanography. It is definitely more complex than what it looks like. 

Sunday 20 September 2015

A parity problem [solution]

Last week, we posted a problem: http://shaanxoryog.hackers.mu/2015/09/a-parity-problem.html

Recap
First, a brief recap of the problem (for a better description, please check the link above):

You need to catch a thief who has evaded in a 1000 x 2 grid. In every hour the thief moves to an adjacent column, either to the left or right (as in picture above). In every hour, you can assign two policemen to search any 2 cells. If the thief is located in one of the two cells, you catch him, otherwise you don't. Devise a strategy which ensures that you can catch the thief within 2015 hours (or less).

Solution
Only one of our readers: $€|v3n proposed a solution by going in-depth into the problem. Unfortunately there was a small flaw in the solution. Anyway, we really appreciate the engagement and effort done to try solving it :)

The correct solution is as follows (details will follow):


Put the policemen in blocks of 2 and:
i) In the first hour, put them in column 1
ii) Then, after every hour, move them by 1 step starting from column 1 up to column 1000
iii) In the 1001-th hour, stay in column 1000
iv) Then, after every hour, move them by 1 step from column 1000 to column 1.

This solution seems very simple. We're just bringing the policemen from X=1 to 1000, then from X=1000 to 1 (taking 2000 hours)

But does it work? How does it ensure that we can catch the thief?

Dry run
First of all, this solution works for any N x 2 grid, not necessarily a 1000 x 2 grid.

Let's illustrate the solution above on a 5 x 2 grid to better see what's happening.
Assuming that the thief was in column 3 in the first hour:

Thief has no choice than move to the right. 

 Thief has no choice than move to the right.

Thief is caught since only possibility is to move to the left!

As you can see above, we caught the thief!
Let's say that, instead, in the first hour, the thief was in column 2 (instead of 3), at a distance of 1 from the policemen. He can skip the policemen by moving to the left in the second hour while the policemen are moving to the right. We will not get him in the first run. But then when the policemen come back from X=5 to 1, they will catch him! (try it on paper)

Parity of distance between thief and policemen
The most important thing to notice to build up the solution above is that in every hour, the thief must necessarily move to an adjacent column, either to the left or to the right - he can't stay in the same column.
Let's denote the column where the thief currently is in by x1 and the column where the two policemen are by x2.

In the next hour, the thief moves either to x1+1 or x1-1.
At the same time, our two policemen move from x2 to x2+1 (we are considering only the first half of the solution to illustrate it)

Before the movement, the distance between the thief and policemen was x1-x2
After 1 hour it becomes either:
x1+1-(x2+1) = x1+1-x2-1 = x1-x2
or
x1-1-(x2+1) = x1-1-x2-1 = x1-x2-2

Interesting. The parity of the distance does not change!
(x1-x2-2 has the same parity as x1-x2 since removing 2 from any number keeps its parity constant. If x1-x2 was odd, the new distance is also odd. If it was even, it stays even after every hour)

How does this help us?

If we somehow manage to catch the thief, then we must be present on the same column as the thief.
The distance between the thief and the policemen is in this case zero - an even parity.

Interesting!
If the original distance between thief and policemen was of even parity and in each move we're keeping it even and at the same time reducing the number of possible moves of the thief, we will eventually catch him!

This was the main trick. We're keeping the parity the same while reducing the number of possible moves for the thief. The thief's moves get constrained until we eventually are on the same column and catch the thief.

Wait wait wait.. This only works if the original parity was even as underlined above.
What if the thief was originally at an odd distance from the policemen?

That's true. But in our solution, when we reach X=1000, it changes the parity to odd!
We're stepping on X=1000 twice, so the parity of the distance gets changed at this point!

And when we come back from 1000 to 1, we will now catch the thief!

To recap - if the distance was of even parity we will catch the thief in first run (from X=1 to 1000), otherwise when we come back from X=1000 to 1, we will catch him!

Game Over.

In another article we posted recently, we talked about 2-player games in general. We're applying the same principle here - keeping the opponent on a "losing" state while reducing the number of moves. That's the trick.


Wednesday 16 September 2015

Hacking the Fort Boyard game and always winning


Do you remember that game from Fort Boyard?
Where you play against the "Maître des ténèbres" removing sticks until only one remains?

If you don't remember no problem, check out the video below:
https://www.youtube.com/watch?v=tng717lJlnA

So, basic rules of the game are:
1) There are 20 sticks
2) Game is turn based. You start first, then it's turn for the "Maître des ténèbres", then yours again...
3) You can remove either 1,2 or 3 sticks
4) If it's your turn and 1 stick remains you lose (the same principle applies for the other player)

So, can we win at this game?
In fact, you can ALWAYS win against the "Maître des ténèbres". There's just a bit of game theory involved, let's see how!

Let's analyse the game. We denote the number of remaining sticks by the variable n.
Let's assume it's currently our turn for different values of n to see what happens:

When n=1, we LOSE.
When  n=2, we can remove 1 stick and can WIN.
When  n=3, we can remove 2 sticks and can WIN.
When  n=4, we can remove 3 sticks and can WIN.
When  n=5, Oops. We don't have the choice: removing 1,2 or 3 sticks will bring us to n=2,3 or 4. So, the other player can win (if he makes the right choice) and we LOSE.
When n=6, interestingly, we can remove 1 stick. This will bring the opponent to n=5 where he loses, so we can WIN.
When n=7, again, we can use the same trick and remove 2 sticks. This will bring the opponent to n=5 where he loses, so we can WIN.
...

If you continue the above procedure, the following pattern will emerge (where L represents Losing and W, winning):
n
1
2
3
4
5
6
7
8
9
10
11
12
13
14
15
16
17
18
19
20
?
L
W
W
W
L
W
W
W
L
W
W
W
L
W
W
W
L
W
W
W

It seems that every 4 steps is a losing position and we can easily derive that any number of the form:
4k + 1 is a losing position while other values are winning positions.

What's happening here?
What does it mean to be on a winning or losing position as in the table above?

In game theory, we always assume that the two players play optimally. That is, if there is a way to win according to the rules of the game, the optimal player will win.

To be on a winning position means that I can always make a move which forces the other player to "land" on a losing position. Since I'm an optimal player, I will make such a move if it's possible.
In our game above, when we are not on a position of the form 4k+1we can always move to such a number by removing 1, 2 or 3 sticks.

To be on a losing position means that whatever choice I make will bring the game state to a winning position for the next player. Even if I'm an optimal player, I can't do anything about it - the other player is as smart as me and he will always make optimal choices and win.
In our game above, when we are on a position of the form 4k+1we can only move to a number that is NOT of the form 4k+1. That's our only possibility.

That's interesting, now let's apply the rules to see how it works in practice.

It's your turn and the game starts with 20 sticks.

20 is a winning position (it's not of form 4k+1). So if we apply the rules optimally, we must win!
We need to bring the opponent to a losing position (of the form 4k+1). 17 is the one - so we remove 3 sticks.
Now whatever choice the player makes, we repeat the same logic above.
If he takes 1 stick, you take 3 sticks.
If he takes 2 sticks, you take 2 sticks.
If he takes 3 sticks, you take 1 stick.
Now, this will force him to reach 13 sticks, another losing position.

We continue the same procedure until the opponent reaches 1 stick and he loses.

Amazed? This is in fact the basic principle used in 2-player games.
You can apply this principle of forcing the other player to stay on a particular "losing" state to many games. As the game state becomes smaller and smaller, the opponent will eventually reach the smallest possible state (which is still a losing position) and lose the game. The difficulty usually lies determining which states are winning and losing ones by deriving a proper formula.

WebSockets and RTC: No more REST for Web Programmers?


Unless you've been living under a rock for the last decade or so, you might have noticed that the world wide web has been producing more and more elaborate websites. And it's really not going to end there - or even at all - until we can telepathically host and browse websites. While waiting for formal specs for a Telepathy Markup Language by the W3C, sparing you a complete history of web design from <table /> until JSON, here's what's going to be hot for web programming from now onwards:


JavaScript

Thankfully some geeks thought it would be a nice idea to add a client-side programming language to web pages. That turned out to be a ridiculously delightful idea. However JavaScript was initially discarded as a "not-so-serious" programming language. Of course. At the time it was being abused by clueless web designers. Made to perform gimmicks, serve alert boxes, animate cursors... and at best used for drop-down menus, it just wasn't something one would consider for serious development. And on top of it all, it was interpreted.

Fast forward to the early 00's. Web 2.0 was born, thanks to the AJAX call, that could asynchronously call and receive data from a service, without a full-page refresh. 

All of a sudden JavaScript became more than just a tool for manipulating the DOM and showing alerts. Web pages were not just dead-end documents with links to other documents. AJAX (and JavaScript in general) truly allowed developers to create web pages that could behave like apps. 

With Web 2.0 JavaScript shot to stardom, and more and more programmers started acknowledging its importance. JavaScript has not stopped gaining momentum since then. Some of the notable technologies that work with JS are Node.js, a server-side JS engine emancipated from the browser, and a wide variety of HTML5 Mobile App development frameworks. There is also the much awaited ASM.js, which I personally think was secretly bestowed upon us by the Gods of client-side obfuscation.


So Many Years of Existence, So Many Types of Browsers


Since the HTML, CSS and JavaScript triumvirate had been around for quite some time, different types of browsers came about at different periods of time. JavaScript too was evolving - slowly but steadily - and although the language now has its specifications formally penned down, massive amounts of web surfers still wander around the thick forest of WWW with that old crappy browser that you thought had already been wiped off the surface of the e-planet.

Logically one would attempt to detect the User-Agent name and version (read: browser name & version) to ascertain what will work and what won't. That technique, called UA Sniffing or Browser Sniffing, is limited to the programmer's knowledge of current browsers, and will likely not work well for new or unknown UA's. To circumvent this problem the W3C recommends y'all to write standard HTML code. 

Still, that doesn't really solve the problem as many old browsers are still lurking out there and it's just a pain to marry historical data with actual coding.


Modernizr.js

Enter Modernizr.js. Modernizr.js completely eliminates the need for scanning the client's UA and instead provides for a more practical alternative: detecting browser features. Give it a try to see what your browser can and cannot do.

Not content with detecting browser features, Modernizr also allows for polyfills. Simply put, a polyfill saves the day when your old browser should've eaten dirt. A polyfill augments the capabilities of your browser by downloading code that will fill in the missing gaps, completely eliminating the need for a window.alert('Sorry your browser is not supported.');.


WebSockets & WebRTC

And if all of that wasn't cool enough, you would be surprised to learn that modern web standards define a new means to communicate with a server: through WebSockets. In a nutshell, web sockets allow for a direct line of communication between a browser and a server. In this architecture, the server can send data directly to the client without the client side having triggered any mechanism requiring the server to do so. 

In other words, instead of refreshing your inbox every now and then, the server can actually send you a notification immediately when an email is received.

Welcome to WebRTC. Real-time communication within web pages.

For any of you who ever implemented an AJAX-based chat system, you must by now have realized that WebSockets deprecate the need for long polling or iframe fiddling. Through the simple ability of a server to communicate with connected clients, massive paradigm shifts are occurring within web programming.

If you have any doubts about whether WebRTC will be of any relevance in the future, check out the WebRTC.org page or see some of its awesome demos, including a video chat client.


Server-Side Coding vs SOA

Here's a simple way to explain what a server-side web programming language does: At the end of any page or service request, it generates HTML, CSS, JavaScript, JSON or XML code to be sent and consumed by a browser. And that's all. That's what all of them do - generate some HTML.

The process of generating client-side code complicates the process of web programming on so many levels, especially if it's a web app. 

A service oriented architecture not only exposes your functionality to other types of applications (there's no need to re-write the same server-side logic), but also simplifies the development process by returning the web's client-server architecture to its simplest form: separating the development of interfaces with that of functionality.

Tuesday 15 September 2015

Visualizing Open NASA Data

NASA & Data

The National Aeronautics and Space Administration (NASA) is the United States government agency responsible for the civilian space program as well as aeronautics and aerospace research - Wikipedia. NASA has made public the data it collects, from satellites as we will see later, for a long time now. They have also been organising a yearly Space Apps Challenge event to promote innovative projects using the data.

This blog post will be about accessing Earth Science Data, focusing solely on CO2 information at a particular altitude range, processing the data, building a map of the Earth and finally presenting the result on the map.

Goal
The goal of this article is to allow you to create a map like or better than in the one below:
https://github.com/Lougarou/Co2D3/

Getting The Right Data

It is important to get the right data source, in this case CO2 data, and to do that we need to find the right NASA Mission. Some places to search include the following: 
Our search for CO2 data will finally end at the Jet Propulsion Laboratory: California Institute Of Technology.  
The next task is to identify which mission suits us, which narrows the data sources to ACOS Gosat Satellite and OCO-2 Satellite. OCO-2 is more accurate so we will be using this one mainly.

Data levels

If you tried to download the data you would notice that there are 2 ways to do so. 
  1. Download level 2 data from a python script
  2. Customize the data and download a level 3 data
Data levels classify the data in different categories of levels 0 to 4. As explained here:

Data Level
Description
Level 0Reconstructed, unprocessed instrument and payload data at full resolution, with any and all communications artifacts (e.g., synchronization frames, communications headers, duplicate data) removed. (In most cases, the EOS Data and Operations System (EDOS) provides these data to the data centers as production data sets for processing by the Science Data Processing Segment (SDPS) or by a SIPS to produce higher-level products.)
Level 1AReconstructed, unprocessed instrument data at full resolution, time-referenced, and annotated with ancillary information, including radiometric and geometric calibration coefficients and georeferencing parameters (e.g., platform ephemeris) computed and appended but not applied to Level 0 data.
Level 1BLevel 1A data that have been processed to sensor units (not all instruments have Level 1B source data).
Level 2Derived geophysical variables at the same resolution and location as Level 1 source data.
Level 3Variables mapped on uniform space-time grid scales, usually with some completeness and consistency.
Level 4Model output or results from analyses of lower-level data (e.g., variables derived from multiple measurements).

Meaning we are going to have to convert our level 2 or 3 data to a level 4 data (our final result).
However! if you tried to download the customized level 3 data you would notice one major shortcoming, that the altitudes are all set to be at 2600 km above the ground and have other limitations. 
This is not what we want for this article, so we are going to process the level 2 data which is very abundant.
The easiest way is to get the python download script here

Note: you can stop downloading after the first few netCDF (.nc4 files around 20mb to 70mb) files for this article. 12+ GB will take too much time on a Mauritian internet connection anyway!

Understanding The Data

Now you should have a bunch of files which looks as follows 

dataoco2_LtCO2_140906_B7101Ar_xxxxxxxxxxxxs.nc4 
dataoco2_LtCO2_140907_B7101Ar_xxxxxxxxxxxxs.nc4 
...

Your first thought would be to open it in a text editor but this is sadly in netCDF format and you require some libraries to easily access it. We will be using it's Java library for this later on. 
The easiest way to get an idea of data is view it with Panoply. Below is a screenshot of the data opened in Panoply.

The dataset shows the data's hierarchy and variables, this will be particularly useful when we will access it in the next section. If you wish to understand the variables, which you normally should, you can read the documentation here. But for this article we will only use longitude, latitude, xco2 and Sounding->altitude.

Processing Level 2 Data

Get your prefered version of netCDF library. An easy way to include it in Java is by making a maven project and adding the following to your project's pom.xml.

 <dependency>  
      <groupId>edu.ucar</groupId>  
      <artifactId>netcdf</artifactId>  
      <version>4.2</version>  
 </dependency>  

Accessing the data within JAVA is even easier. Below is a snippet to give an idea of this.

dataFile = NetcdfFile.open(filename, null);  
// Retrieve variables  
final Variable xco2 = dataFile.findVariable("xco2");  
final Variable latitude = dataFile.findVariable("latitude");  
final Variable longitude = dataFile.findVariable("longitude");  
final Variable altitude = dataFile.findGroup("Sounding").findVariable("altitude");  
ArrayList<Array> res= (ArrayList<Array>) dataFile.readArrays(new ArrayList<Variable>(){{  
     this.add(xco2);  
     this.add(altitude);  
     this.add(latitude);  
     this.add(longitude);  
}});  

But why is it necessary to even process the data? I mean, we have all the required data to plot this on a map. In order to understand why, let's actually plot it on a graph without any processing!

Making A Map

Let's move away from the world of Java, make a map and use D3 to draw it. Thankfully for us, the open source spirit lives inside the cartography community as well. We are going to make our own map instead of using Google Map or Openstreet Map. If you want to use the Google Map or another map you can skip this part.

The first step is get a shapefile of the earth from Natural Earth Data. Since the accuracy of our data is basically by 0.5 degrees of either longitude or latitude download the small scale data. Once you have downloaded your .shp file, the next step will be to convert it into GeoJSON format. In order to do that we need yet another tool ogr2ogr. Using og2ogr:

ogr2ogr -f "GeoJSON" "countries.geojson" "ne_10m_admin_0_countries.shp"

You should now have countries.geojson, but we will not stop there. Next install Topojson (using npm install -g Topojson). Then using Topojson:

Topojson -o countries.topojson countries.geojson

Notice that there is an 80% compression rate from GeoJSON to TopoJSON. You should now have a topojson file as follows http://pastebin.com/1sRWybhe

If you feel lost at any point consult this documentation http://bost.ocks.org/mike/map/

Displaying The Map

Download our example source code from Github to help with the following example. Make sure to run it on a web server. This is because D3 needs to know the path of the external files that are being read like countries.topojson.

We will be using D3.js and topojson.v0.min.js to visualize the map. Create a .html file and include the following libraries after downloading them.

 <script src="js/d3.min.js"></script>  
 <script src="js/topojson.v0.min.js"></script>  

Create a div element and then we can use some Javascript to read countries.topojson and to draw it in SVG.

 <div id="divMap"></div>  

var projection = d3.geo.mercator();
worldSvg = d3.select("#divMap").append("svg").attr("style","display: block;margin:auto;")
   .attr("width", 1000);
path = d3.geo.path()
   .projection(projection);

Those are the main parts of the code to generate the world map.

We start by telling D3 to create a Mercator Projection. This is because our data is in latitude and longitude, but we would like to draw it as pixels in SVG. D3 facilitates this job using projections.

d3.json("countries.topojson", function(error, topology) {  
 countries = g.selectAll("path").data(topojson.object(topology, topology.objects.countries_new)  
                .geometries);  
  countries.enter()  
 .append("path")  
 .attr("d", path)  
 .attr("class","country")  
 .attr("stroke","black").attr("fill", "white").attr("stroke-width","1");  

After that we read our countries.topojson file. If you look inside of it you would notice that every country is actually a geometry file. Using D3 we read into those geometries and draw them in worldSvg and svg dom element. The geometry points are in latitude and longitude but projection we defined before does the job of converting those points to the points on your screen. The rest of the .attr (attributes) specify the color and other details. Feel free to play with in our source.
Also, for some cool effects, try to use an orthographic projection.


You should get something similar to the above screenshot if everything went well.

Plotting Our Level 2 Data

First of all congratulations for getting this far. You are a patient one. Now if code a Java program to generate, for example a simple csv file as follows:

xco2,latitude,longitude
397.2427062988281,-40.625553131103516,175.2617950439453
396.0091857910156,-12.630569458007812,169.10618591308594
396.2909240722656,-12.609465599060059,169.06430053710938
396.73992919921875,-12.18317699432373,169.01231384277344
396.9307861328125,-12.164556503295898,169.0084228515625
396.8463134765625,-12.18188762664795,168.9932403564453
....

Then using the example D3 code. Draw small rectangles(small ones because of the smaller longitude and latitude variance in this one compared to the one inside our Github example). You should get the following picture.


Well this is not really useful and THIS is the reason why we should process it further.

Processing Level 2 Data Into Level 3 Data Into Level 4 Data

The algorithm involved in processing the level 2 data to a level 3 data is up to you. In this article we will talk about a simple clustering algorithm using QuadTile. Which basically involves sectioning our map into different squares. Then we keep an average CO2 PPM(Parts Per Million) value for every square(first column in the above csv). This also means that the more squares that we use the more accurate the level 3 data will be. A sample java algorithm is outlined below:

 ArrayList<ArrayList<Double>> quadTiles=new ArrayList<ArrayList<Double>>();  
 int chunks = 32;  
 for(int i=-179;i<=180;i+=360/chunks-1){  
      for(int j=-89;j<=90;j+=180/chunks-1){  
           ArrayList<Double> tile = new ArrayList<Double>();  
           //Bounds  
           tile.add((double) i);  
           tile.add((double) j);  
           tile.add((double) (i+360/chunks-1));  
           tile.add((double) (j+180/chunks-1));  
           tile.add((double) 0);  
           quadTiles.add(tile);  
      }  
 }   
 for(int i=0;i<res.get(0).getSize();i++) {  
      for(int j=0;j<quadTiles.size();j++){  
           //check if point lies inside the tile  
           if(res.get(2).getDouble(i)>=Math.min(quadTiles.get(j).get(1),quadTiles.get(j).get(3)) &&  
             res.get(2).getDouble(i)<=Math.max(quadTiles.get(j).get(1),quadTiles.get(j).get(3)) &&  
             res.get(3).getDouble(i)>=Math.min(quadTiles.get(j).get(0),quadTiles.get(j).get(2)) &&  
             res.get(3).getDouble(i)<=Math.max(quadTiles.get(j).get(0),quadTiles.get(j).get(2))){  
             if(quadTiles.get(j).get(4).equals(0)){  
                  quadTiles.get(j).set(4,res.get(0).getDouble(i));  
             }else {  
                  quadTiles.get(j).set(4,(res.get(0).getDouble(i)+quadTiles.get(j).get(4))/2);  
             }  
           }  
      }  
 }  

We are basically creating chunks/tiles in the map and then we check whether the points of level 2 data fall into those tiles. We are using -179 instead of -180 to start our longitude because D3 has issues with displaying -180, this is a quick sacrifice which will affect accuracy and should be avoided if possible.
Then if a point lies inside that tile, we update it's average CO2 PPM value. Then if we use this data to generate a csv file as seen here http://pastebin.com/wZVYj0p2 and if we plot it(the level 3 Data we just made) the result is as follows(the level 4 Data).


This plot is much more indicative of the sinks and souces of CO2, but still not very accurate, as we have used only one .nc4 file and sampled it as an average on 1620 tiles only.


Final words & Inspirations

With enough of processing and data, one can plot a lot of accurate things like the following:


The second diagram shows CO2 PPM concentration at a 2600 km altitude(2014) while the first one at 600km altitude (2013). That was why altitude was important. They are both level 3 Data from https://co2.jpl.nasa.gov/ . The second diagram actually contains 64000 points.

This blog post only talks CO2 data but there is an enormous amount of data on other things like sea level or heat. You could may be monitor the sea level around the Maldives or look at the heat levels in India!
It is now up to you to use this power, may be for a good cause!

- Yog